Recent Posts
-
Witaj, świecie!
•
Witamy w WordPressie. To jest twój pierwszy wpis. Edytuj go lub usuń, a następnie zacznij pisać!

Partner with us, and let’s embark on a transformative marketing expedition that captivates, inspires, and drives exceptional results.
From local triumphs to global milestones, we’ve curated a diverse portfolio that speaks volumes about our dedication to achieving results.

This is where ideas take flight, fueled by collaboration and a passion for crafting unique brand narratives. Our team thrives on pushing boundaries and exploring uncharted territories, finding inspiration in the intersection of diverse perspectives.

Our expert developers, designers and tech enthusiasts merge innovation with precision and efficient coding. With a meticulous approach, we architect custom solutions that resonate with cutting-edge technology and industry best practices.

We delve deep into the analytics, deciphering the language of numbers to unveil compelling narratives behind the trends. Our team of analytical wizards doesn’t just crunch numbers; we extract meaningful patterns and unearth hidden opportunities.
Collaboration lies at the heart of everything we do at Loomi. We believe in the collective strength of diverse perspectives, where every voice contributes to crafting superior solutions

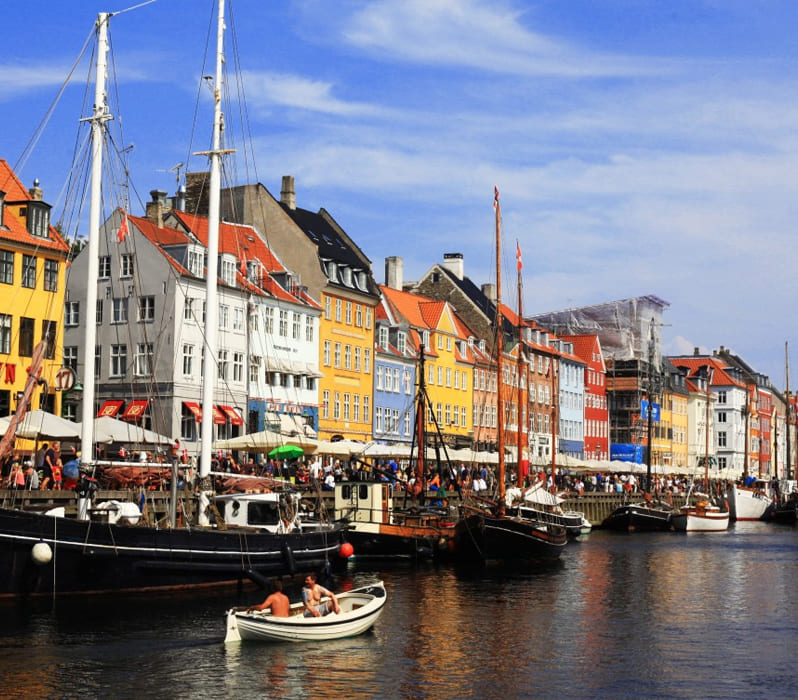
From the iconic Nyhavn to the innovative corridors of tech, our location isn’t just an address; it’s a testament to our connection with a city that fuels our creativity and shapes our perspective.

Owner of Yellow Bird

Let’s collaborate to elevate your brand, amplify your message, and achieve your goals.
Dive into a world where expertise meets exploration, where we share our thoughts on the latest trends, strategies, and emerging technologies.
Need assistance? We’re here for you! Your success is our priority, and we’re dedicated to providing the support you need, when you need it.
•
Witamy w WordPressie. To jest twój pierwszy wpis. Edytuj go lub usuń, a następnie zacznij pisać!